Snapshot
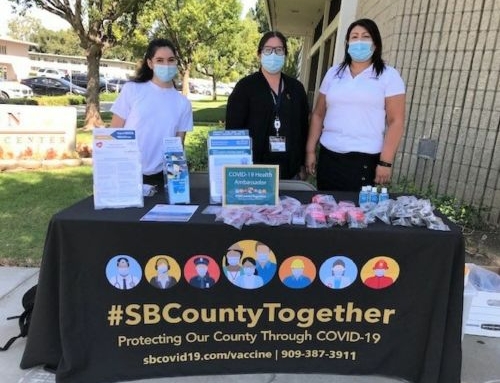
In 2013, the Portsmouth Health Department (PHD) completed the first Community Health Assessment Survey (CHS) in Virginia using the Community Assessment for Public Health Emergency Response (CASPER) methodology. This methodology, traditionally used for emergency response, is a two-stage random sampling of door-to-door household surveys. The methodology allows the households surveyed to collectively serve as a reasonable representation of the entire city. The surveys gathered data on general health, household preparedness, health care access, nutrition, and physical activity. In 2014, PHD completed a second and more comprehensive CHS, this time gathering data on physical activity, obesity, tobacco use, heart disease, diabetes, mental health, and maternal and child health. Through the use of ArcGIS apps and software, data gathered is available at the neighborhood level, providing the most micro-level data available on the health status of the community. This survey also used a cross-platform approach to collecting data. During a 72-hour time frame, PHD collected over 300 surveys either online or by knocking on doors. The data collected has provided critical baseline data for Healthy Portsmouth’s Community Health Improvement Plan. The CASPER methodology allows a low cost, time-efficient means of collecting primary data that will complement the secondary data already available from state and national entities.
Problem Addressed
Portsmouth is an independent city located in the southeastern portion of Virginia near the Chesapeake Bay with an estimated 95,535 residents. Due to the small size of Portsmouth, city-level data through traditional surveys like the Behavioral Risk Factor Surveillance System (BRFSS) are sparse. An advocate for data-driven decisions, PHD decided to prioritize limited staff resources to gather local data to complement secondary data already available. With a limited budget and a staff of 60, PHD needed a method to collect the data with the minimum number of staff possible. Using 24 staff members and 10 volunteers over 72 hours, PHD was able to collect enough surveys so that data is now available not only at the city level, but also the neighborhood level. Implementing the CASPER methodology has allowed PHD to collect census tract-level data, which is vital to data-driven decisions for community specific programing and services.
The objectives of the 2014 Portsmouth CHS were:
- To gain a better understanding of health at the local/neighborhood level in Portsmouth.
- To exercise and train public health professionals in using CASPER methodology in a local health district.
- To gather baseline individual and household data for the Portsmouth Community Health Improvement Plan (CHIP) to measure progress in strategies identified by Healthy Portsmouth.
- To engage specific communities by conducting household interviews.
- To learn and effectively use ArcGIS™ and the Collector™ App to create spatial analysis maps of health indicators.
Innovation Summary
The CASPER methodology was modeled after the World Health Organization’s Expanded Program on Immunization adaptation of traditional epidemiologic techniques, which was developed in the 1970s to identify needs and estimate immunization status of communities in developing countries. CASPER was adapted by the Centers for Disease Control and Prevention (CDC) as a public health emergency preparedness tool to assist public health and emergency management professionals to quickly access the health status and basic needs of an affected community in the aftermath of a disaster or adverse event.
Novel: PHD meets PHNCI’s definition of innovation being novel through its use of CASPER to collect health status information about its population. PHD conducted the CHS in Portsmouth from October 28–31, 2014. The team applied the CASPER methodology, described in the CDC CASPER Toolkit Version 2.0, to define the households within the sampling frame of the city. Based on the 2010 US Census, the total number of housing units in this area was 40,806. Using the standard CASPER two-stage cluster sampling design, PHD randomly selected 35 clusters with the aim of completing seven interviews per cluster. PHD used CDC’s GIS cluster selection tool for automated sampling, which requires Esri’s ArcMap 10 to randomly select the clusters and develop cluster maps. Additional GIS layers for the maps were provided by the City of Portsmouth. Using Epi-Info and Esri’s spatial analysis software, neighborhood profiles were created with a combination of primary data from PHD’s CHS data and secondary data from the Census Bureau’s American Community Surveys.
Co-Production of process with Partners and Stakeholders and Cross-Sector Collaboration: In preparing for, conducting, and analyzing data from the CHS, PHD personnel collaborated with local city partners, other local health departments, the state health department, and a local medical school. PHD personnel and public health graduate students from Eastern Virginia Medical School (EVMS) developed a two-page survey to capture information about general health status, which included physical activity, nutrition, tobacco use, mental health, teen pregnancy, infant mortality, access to care, and perceptions of health. Standardized survey questions were derived from sources such as BRFSS, the Howard County Health Assessment Survey, and the first CASPER conducted in Portsmouth in 2013. CASPER materials from CDC and other health departments were used to develop all PHD materials. PHD staff, volunteers from the Portsmouth Medical Reserve Corps, city of Portsmouth staff, Norfolk Health District staff, EVMS students, and staff from the Virginia Department of Health’s Office of Epidemiology conducted the field interviews. A three-hour training was provided to the field teams to address the CASPER methodology, safety, logistics and electronic data capture using the Collector™ App installed on six smart phones and three tablets.
Replication: The entire PHD CHS process can be replicated by other health districts. PHD has assisted several local health districts in Virginia in adapting CASPER to collect census-tract level data in their respective health districts. Using the CDC’s CASPER toolkit and free software to analyze the data, such as EPI-Info, other health departments can adapt the CASPER methodology to their own needs.
Outcomes & Impact
The data collected has provided critical baseline data for Healthy Portsmouth’s Community Health Improvement Plan. Presenting the data in map form and as neighborhood profiles brings the data tables to life for our community partners, allowing for a more digestible and meaningful representation of the data. The maps also highlight areas where PHD and community partners can focus public health interventions. As word has spread about the CHS, more community partners have requested the data and used them in presentations, grant applications, and decision-making.

Challenges & Barriers
Teams faced technological challenges with the app used and the mixed technology of cell phones and tablets. Challenges included questions becoming truncated due to the mixed use of iOS and Android devices, as well as drop down versus free-text fields, and minor changes (location of menu options/size of text) within the app between a tablet and a phone. These challenges caused some delays in the field on the first day of interviews. Teams also encountered barriers when conducting interviews. Gated communities and some apartment complexes considered the field teams to be “solicitors” and denied them access to those communities. More detailed discussion with property managers and communities may improve this barrier in future years. Discussion should include sharing the importance of the survey as well as the data itself with community members to encourage participation and buy-in. The comfort and safety of teams is also an important consideration – picking a time of year when the weather is comfortable and the sun doesn’t set too early is important. For example, in October the sun sets earlier and teams were not able to stay out during “critical” evening collection hours. Also, evenings can be cool and uncomfortable for the field teams. Future surveys will be conducted in warmer seasons with longer daylight.
Lessons Learned
One of the lessons learned would be to identify clusters 3-4 months prior to the survey to determine if any clusters may be gated or have apartment complexes. This allows plenty of time to contact the locations and gain approval for the survey. Additionally, starting survey development early will allow more time to develop the survey instrument, create the data dictionary, and design the questionnaire in the app. Soliciting input from a diverse group of community partners will make the questionnaire more comprehensive and address additional social determinants of health. The results of a broader questionnaire would be more meaningful to a variety of community partners. Community partners are also critical during the actual surveying process. As internal staffing resources are limited, a focus should be made to involve more community volunteers for the field teams. Staffing for the community health survey is an important process. An Incident Command System structure is well-suited for the project to ensure that one person does not have overlapping roles (i.e. your epidemiologist should not be the project lead given the heavy questionnaire and data analysis roles they will have).
Technology is both a benefit and a detriment to the surveying process. Data analysis is faster with electronic data collection, but requires more training. For example, our staff needed more hands-on time with the tablet and apps. Also, using the same technology, future surveys might go more smoothly by using either all IOS or Android-based devices, and/or only tablets or cell phones.
We highly encourage a communications plan for the event. The plan should be broken out into three parts: before the event (getting the word out), during the event (presence of field teams and online surveys), and after the event (survey results).The plan should include using various types of media to help get the word out: Social Media (Twitter, Facebook, NextDoor), local TV media, newspaper, email listservs, and posters in common locations. Neighborhoods often have additional communication options such as newsletters, Facebook groups, bulletin boards, and civic group meetings. All of these options should be considered as ways to both encourage participation and heighten awareness of the event.
Sustainability
PHD plans to conduct the CHS biannually to assess changes in health behaviors and health status. Core questions will remain the same to track changes, but supplemental questions can be added or removed based on the changing needs of PHD or community partners. Dedicated equipment has been purchased through a grant to ease the technology barriers. Staff will continue to research and think of ways to collect the data with as few resources as possible to make this a sustainable project.